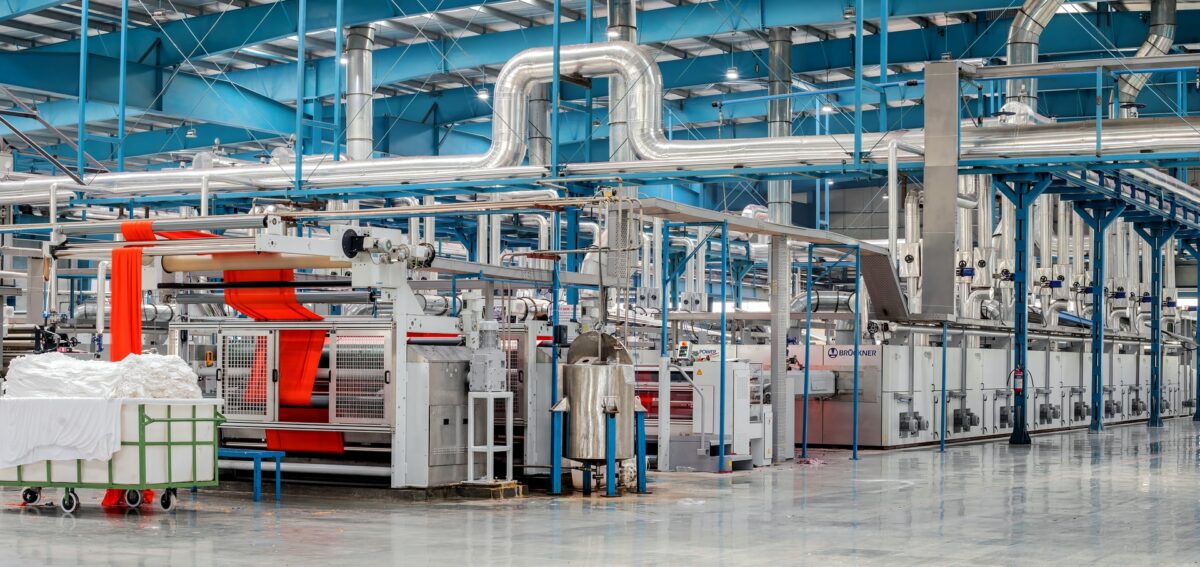
I have worked in the industrial automation field for over 15 years. My focus has been on automotive assembly and life science. I have had a hand in other industries such as food and beverage, robotic material handling, palatalized conveyor systems and vision systems.
My background is in electrical engineering, but I have shifted to more of a software focus. I’m still glad to specify and select electrical equipment and components, and work with schematics.

Industry Presentations
I was invited to present at the Siemens Automation Summit on two occasions.
In 2017 I presented a breakout session on Modular Code. This focused on setting programming guidelines for a team and using reusable, easily readable code. The reusable code allows for quickly commissioning and deploying a new machine.
The following year I presented a highly technical topic discussing the detailed configuration of IO with respect to machine functions. The goal was to speed up machine throughput by correctly organizing IO and utilizing IO to OB mapping to read inputs and write outputs just-in-time.

Programming Philosophy
A modern factory demands up-time. This means that if something goes wrong with the controls system on third shift, the program must be easy to understand and troubleshoot for the technician on duty.
Even though the latest PLCs and software languages allow for very cute, concise blocks of code that do a lot of work I prefer to keep these to a minimum. Those blocks require a through understanding of the programming language and can often mask a problem in your system, especially at 2am.
Comments in any program a must. I strive to comment every grouping of rungs or code that make up a small task within the machine. Within these comments I write not only “it does this” but also “because of this”. By also documenting the “because” in the comments I hope to leave as clear as possible a picture of how the machine works for anyone needing to work on it in the future.

Other Projects
In my spare time I contribute to open source projects, and have created several of my own.
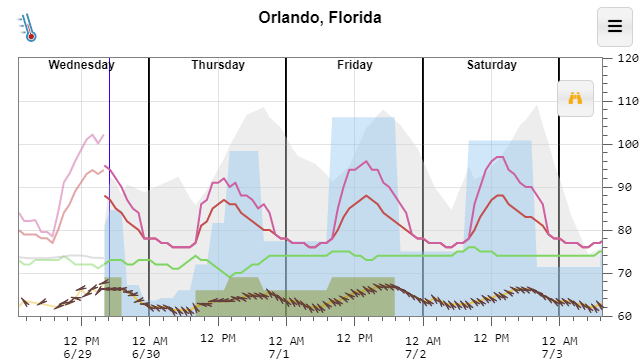
Temperature.Express visualizes the weather forecast as an easy to read chart.
I have created a set of tools to both parse and visualize data that is available freely from the National Weather Service’s NEXRAD radars.
A total of 4 tools are used to parse and plot the two different types of data that is available: nexrad-level-2-data, nexrad-level-2-plot, nexrad-level-3-data and nexrad-level-3-plot.